Kubernetes Dashboard: Features, Security Concerns, and Best Practices
The Kubernetes Dashboard is a popular web-based interface designed to simplify the management of Kubernetes clusters. It provides an intuitive UI that allows users to view and manage cluster resources without needing to work directly with command-line tools. However, while convenient, the Kubernetes Dashboard also presents specific security risks that should be carefully managed, especially in production environments.
What is the Kubernetes Dashboard?
The Kubernetes Dashboard is an official add-on for Kubernetes, offering a graphical interface that streamlines cluster administration tasks. Key features include:
- Resource Visualization: Provides a comprehensive overview of the cluster’s resources, including nodes, pods, namespaces, and workloads. This visual layout helps users quickly assess the health and performance of their applications.
- Workload Management: Allows users to create, scale, and update Kubernetes objects like deployments, services, and config maps without using CLI commands.
- Resource Monitoring: Offers insights into resource utilization, with metrics showing CPU and memory usage per namespace, node, or workload.
- Troubleshooting: Makes it easier to troubleshoot application failures, as users can review pod logs, observe live data, and access key details of each resource.
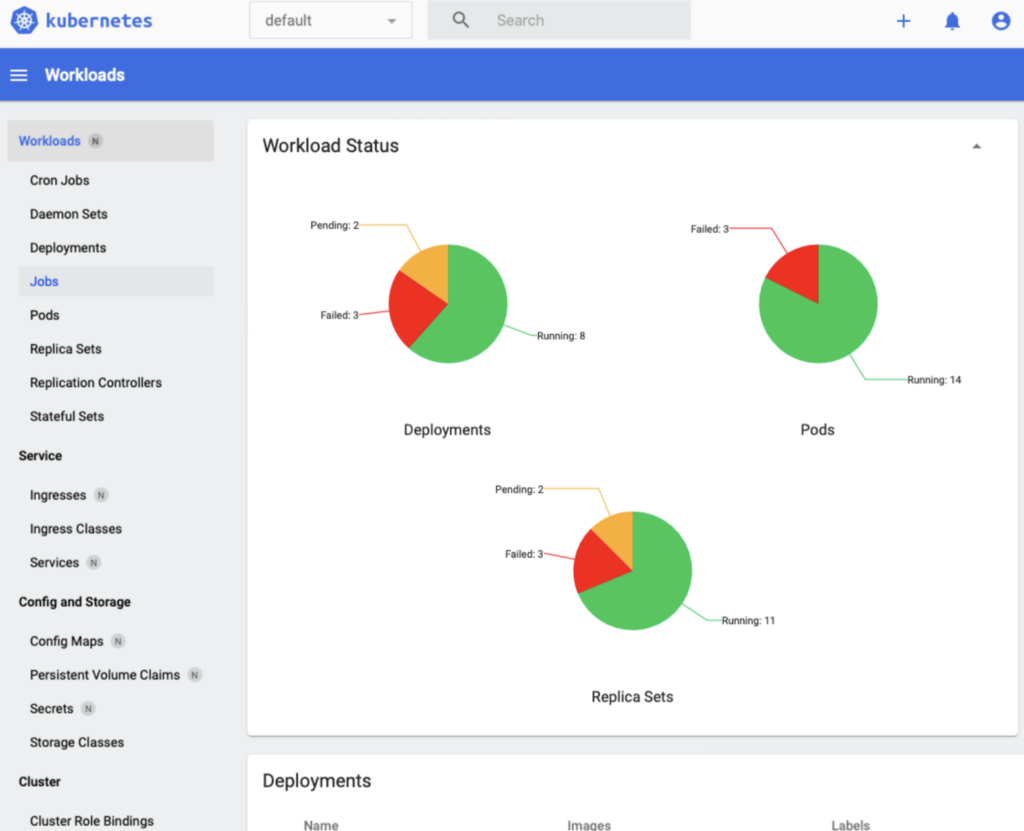
While these features are powerful, they can also expose your cluster to risks if improperly secured, which is where understanding the associated threats becomes essential.
Potential Security Threats to the Kubernetes Dashboard
The Kubernetes Dashboard is useful but also a common target for attacks, especially if exposed to the internet or accessible without proper authentication. Here are some specific threats:
- Unauthorized Access: The Dashboard has broad permissions by default, allowing users to perform sensitive operations. If misconfigured or left exposed, an attacker could gain access and potentially take over the cluster, manipulate workloads, or access sensitive data.
- Lack of RBAC Controls: Many administrators set up the Dashboard with overly permissive roles, bypassing Kubernetes’ Role-Based Access Control (RBAC). Without enforcing fine-grained permissions, this can lead to excessive access, making it easier for an attacker to compromise critical resources if they gain access to the Dashboard.
- Exposed Service: Exposing the Dashboard on a public IP or allowing external access can inadvertently open the cluster to internet-based threats. Attackers scanning for open services may find the Dashboard and attempt unauthorized access, especially if authentication is not enforced.
Threats from Unauthenticated API Endpoints in the Kubernetes Network
In addition to Dashboard-specific risks, Kubernetes clusters have unauthenticated API endpoints accessible within the internal network. While these endpoints are typically intended for internal use, they can present security risks
- Exposing Sensitive Information with
/metrics: The/metricsendpoint may provide details about recent Dashboard logins and memory configurations. When left unauthenticated, this endpoint can reveal login activity patterns. Such information could aid an attacker in planning targeted attacks or identifying key resources to exploit. - Dashboard Configuration Access via
/settings: The/settingsendpoint can expose information related to the Kubernetes environment, including namespaces, cluster names, and other configuration details. - WebSocket Exposure with
/api/sockJS: The /api/sockJS endpoint is commonly used for real-time web communications and often doesn’t require authentication by default.
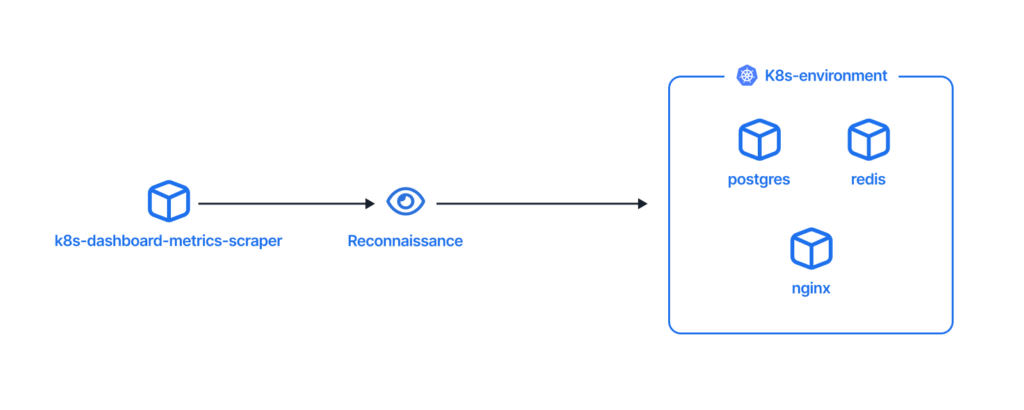
How to Check if These Endpoints are Exposed in Your Environment
If you’re concerned about these unauthenticated endpoints being exposed in your Kubernetes environment, you can check their accessibility by following these steps:
1. Identify the Kubernetes Dashboard Service IP
First, find the IP address of the Kubernetes Dashboard service by running:
Copied
This will display the IP and port details for the Dashboard’s API and web services.
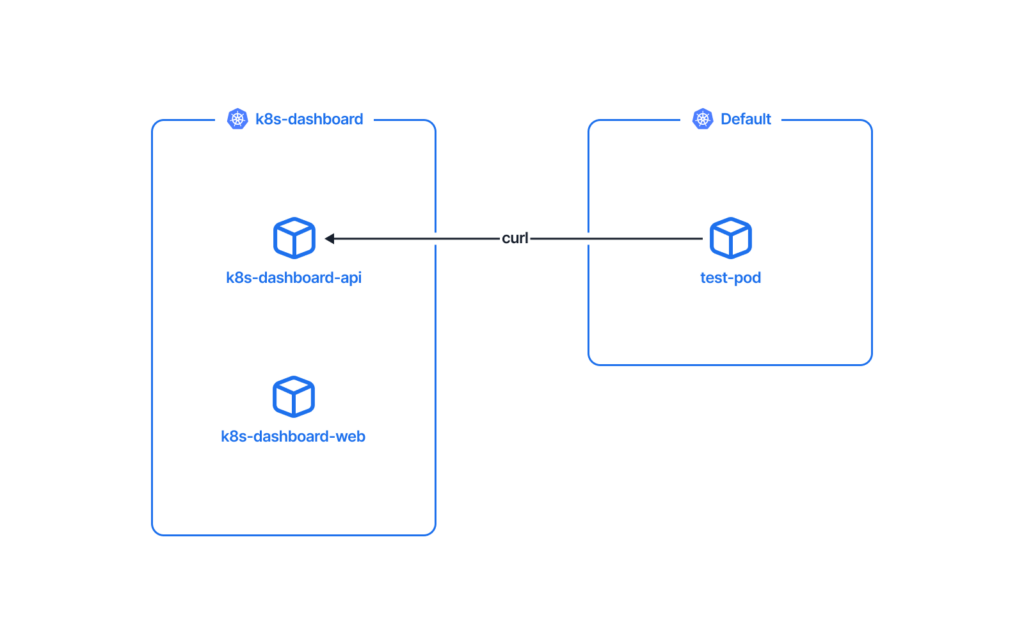
2. Attempt to Access the Endpoints from Another Pod
From a pod in a different namespace, try reaching these endpoints using curl. This will help you determine if they’re accessible across the cluster:
Copied
If these commands return data, it indicates that these endpoints are indeed exposed to other pods in the cluster. In such cases, it’s recommended to implement network policies to restrict access. This simple check can help you quickly assess and address any potential exposure in your environment.
Best Practices for Securing the Kubernetes Dashboard and API Endpoints
To minimize the risks associated with the Kubernetes Dashboard and unauthenticated API endpoints, consider the following recommendations:
- Secure Access to the Dashboard:
- Use RBAC to restrict access to the Dashboard, granting only the necessary permissions for each user or team.
- Avoid exposing the Dashboard on a public IP. Instead, limit access through secure channels like VPNs or by setting up
port-forwardingover an SSH connection.
- Restrict Internal API Access:
- Use Kubernetes Network Policies to enforce strict controls over which pods and namespaces can access specific API endpoints. Limit network traffic between services to only what is necessary.
- Regularly Monitor and Update:
- Continuously monitor Dashboard access logs and audit Kubernetes API access patterns to detect unusual activity.
- Keep the Dashboard and Kubernetes components updated to avoid vulnerabilities that may expose the cluster to exploits.
Conclusion
The Kubernetes Dashboard is a valuable tool for managing and visualizing cluster resources, but it must be carefully configured to avoid exposing your cluster to security risks. By enforcing RBAC, securing network access, and implementing strong runtime detection, you can significantly reduce the risk of unauthorized access and protect sensitive information within your Kubernetes environment.
How Upwind Protects Your Kubernetes Environment
Upwind offers a comprehensive security solution that monitors your environment’s runtime data, such as processes and network traffic between components, to provide real-time alerts on abnormal behavior.
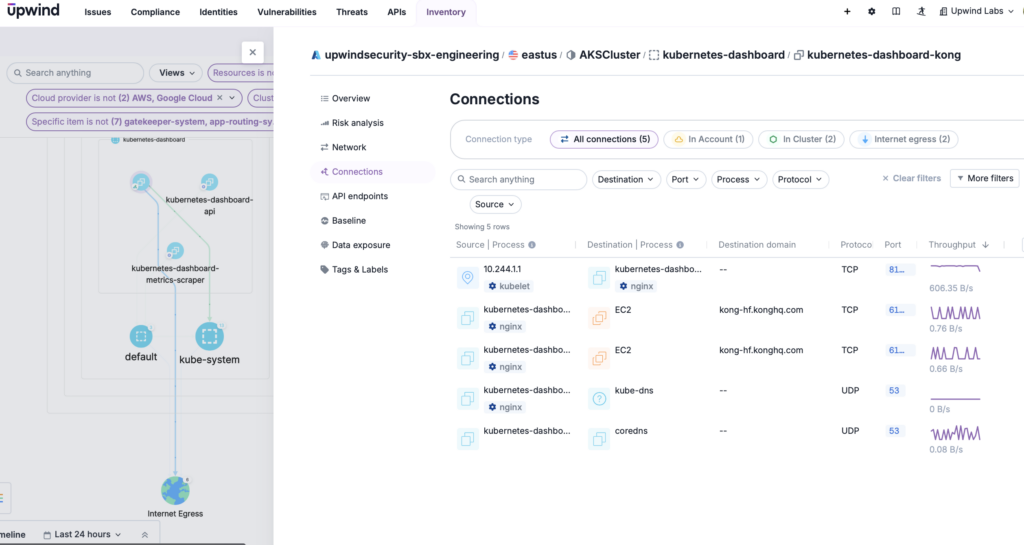
Upwind is uniquely equipped to detect threats related to the Kubernetes dashboard by providing deep visibility into all cluster activities and leveraging a powerful runtime detection engine. This includes:
- Monitoring real-time access to the dashboard
- Tracking API calls made through the dashboard
- Identifying unauthorized or suspicious actions such as privilege escalation attempts, token abuse, or unusual user behaviors.
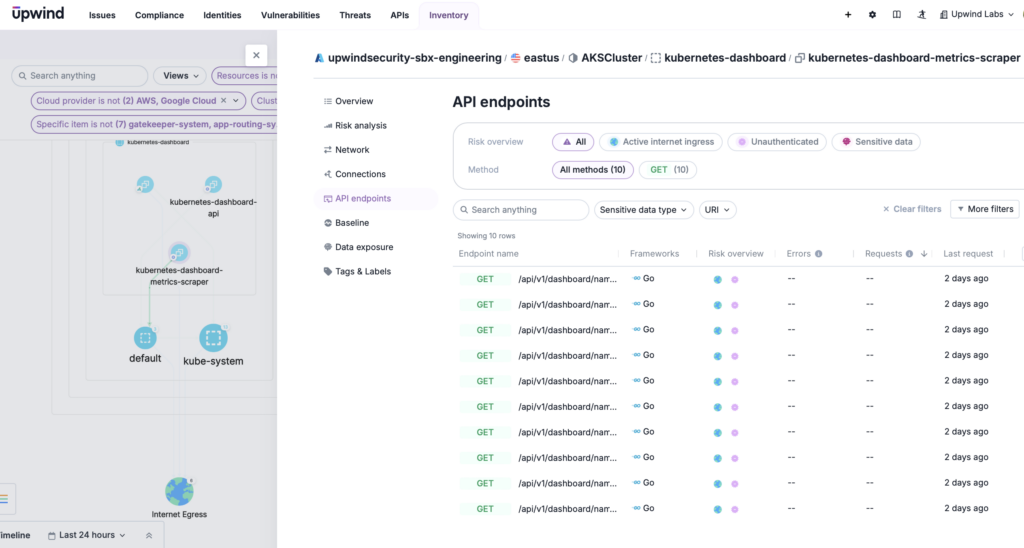
By correlating runtime data with identity-based checks and misconfiguration detections, Upwind also empowers you to proactively reduce risk to the Kubernetes dashboard, pinpointing vulnerabilities like over-permissive access or exposed endpoints tied to the dashboard. These capabilities ensure comprehensive protection against threats targeting the Kubernetes dashboard, helping you maintain a secure and controlled environment. To learn more about how Upwind protects the Kubernetes dashboard, schedule a demo.

