Kubernetes audit logs are a cornerstone of cluster visibility. They capture the who, what, and when of user and service activity. But their sheer volume and complexity often create bottlenecks for security teams trying to distinguish meaningful anomalies from routine noise. We’re going deeper into the role of Kubernetes audit logs in DevSecOps workflows, exploring their potential and limitations in detecting threats in dynamic environments.
Let’s Review: What Are Kubernetes Audit Logs?
Kubernetes audit logs are detailed records of all API server requests, capturing key information such as:
- Who made the request
- When it occurred (timestamp)
- What resource was targeted (e.g., pod, service)
- Action taken (create, update, delete)
- Outcome of the request (success, failure)
Kubernetes includes built-in audit logging capabilities, but they are not enabled by default. To use audit logs, cluster administrators must configure an audit policy that defines what events to log and set up external tools for storing, managing, and analyzing the logs effectively.
Kubernetes logs provide contextual security for containers by identifying threats at the cluster orchestration level. However, unlike in Kubernetes runtime security, they don’t monitor processes or behaviors occurring inside the containers themselves.
Audit logs are indispensable for both operations and security, offering actionable insights into cluster activity.
Operational Insights
From an operations standpoint, Kubernetes audit logs provide visibility into resource utilization so teams can identify which developers, workloads, or containers are consuming disproportionate compute resources. This data gives operations teams the tools to optimize resource allocation, reduce costs, and prevent bottlenecks in highly dynamic environments. However, the challenge lies in correlating raw log data with actionable trends — it can require tooling and expertise to derive meaningful insights.
Security Use Cases
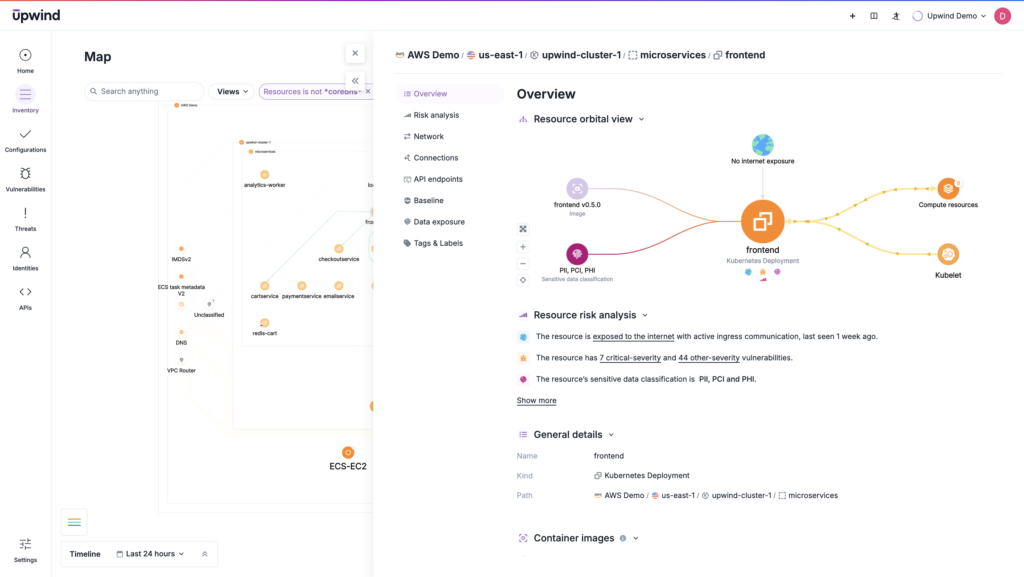
From a security perspective, audit logs are a critical line of defense. They can uncover how attackers gained initial access, escalated privileges, or moved laterally across containers and into host systems. Beyond detection, these logs are used in post-incident forensics, allowing teams to reconstruct a detailed timeline, pinpoint the attack vector, assess the scope of the attack, and, ultimately, assign accountability.
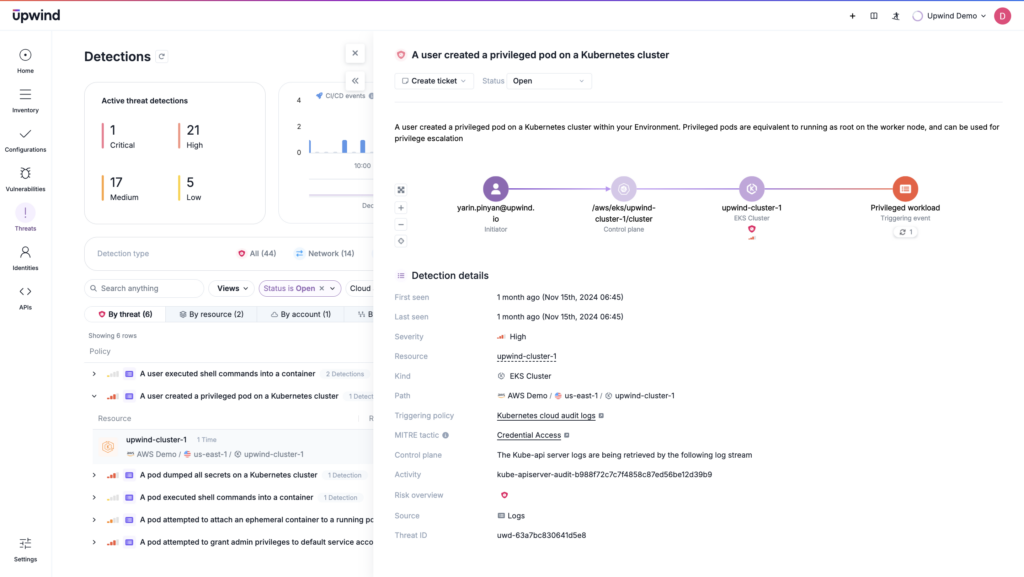
In runtime security, proactive monitoring of audit logs often determines whether an attack is stopped midstream or allowed to progress unchecked. Yet, the sheer volume of logs in a busy Kubernetes environment can overwhelm traditional analysis methods, requiring organizations to balance comprehensive monitoring with efficient signal-to-noise filtering.
As the most comprehensive activity record within Kubernetes runtime, audit logs are foundational to securing containers and their infrastructure. However, their value depends on effective collection, processing, and analysis.
Components of Kubernetes Audit Logging
To fully harness the operational and security power of audit logs, it helps to start at the beginning, with their components, how they’re generated, and how audit policies control their collection and use.
Kubernetes audit logs originate within the kube-apiserver component. Each time a user or process makes a request, an audit event is generated at every stage of the request’s execution. Next, the event is processed based on a pre-defined audit policy and written to a backend. The audit policy specifies which events to log, while backends — such as log files or webhooks — manage the storage of these logs.
Audit policies define rules about which requests are recorded and what information each request needs to include. To set up an audit policy, teams must first record the parameters about the events that need to be logged. This includes defining which level of event needs to be recorded, which external storage needs to receive the log data, and the amount of time to retain log data.
Properly configuring the audit policy to store the right activity data and retain it for an appropriate length of time ensures that companies can maximize the use of Kubernetes audit log data.
To analyze logs, DevOps and DevSecOps teams examine the structured JSON data within each log entry by looking for patterns or anomalies across the logs. The analysis typically involves using dedicated monitoring tools or security information and event management (SIEM) solutions to filter, query, and visualize the data to pinpoint suspicious behavior or compliance issues.
By carefully configuring audit policies, teams can ensure that logs capture the right events with the necessary detail, avoiding unnecessary noise while retaining critical information. When combined with robust analysis tools like SIEMs, these logs transform into a powerful resource for identifying threats, ensuring compliance, and optimizing resource allocation.
Kubernetes Audit Log Best Practices
Managing Kubernetes in production environments has become a linchpin for modern cloud-native security and operational strategies—but it’s no secret that teams often feel the pressure to “get it right.”
“When done correctly, containers are a really strong security boundary. The problem is what does being done correctly really mean for your organization.” — One CTO on “Hacking Kubernetes”
The controversies surrounding Kubernetes security often center on balancing comprehensiveness with practicality. Logging every event can overwhelm storage and analysis pipelines, while overly selective logging risks missing critical activity. Furthermore, with the increasing adoption of tools like CNAPPs, some question whether Kubernetes-native audit logs are enough. Ultimately, logs work best when coupled with runtime insights offered by more comprehensive solutions, keeping the following best practices in mind:
Focus Audit Policies on Critical Issues
Properly configured Kubernetes audit logs are an important foundation for deriving actionable insights and maintaining security and compliance. But achieving it involves setting a well-defined audit policy and choosing appropriate storage backends.
A well-defined audit policy specifies:
- Events to log: Determined by matching rules.
- Logging levels: Options include:
- None: Do not log events matching this rule.
- Metadata: Log request metadata (e.g., user, timestamp, resource, verb) without the request or response body.
- Request: Log metadata and the request body, excluding the response body.
- RequestResponse: Log metadata, request, and response bodies.
A basic audit policy configuration might look like this:
Copied
Using fields like omitStages to exclude unneeded stages (e.g., RequestReceived) helps filter noise so the resulting logs are focused on meaningful events.
Use External Storage for Secure and Scalable Log Retention
Audit logging operates on two levels:
- Policy: Determines which events to capture.
- Backend: Specifies how logs are stored or forwarded.
Audit log management requires external storage since storing logs in etcd is neither supported nor practical for long-term retention. Instead:
- Use webhook backends or log forwarding tools to send logs to external storage.
- Configure retention policies to meet compliance requirements, often mandating retention periods from 2 months to 7 years.
Build a Foundation for Incident Response
Routing logs to external storage enables advanced security monitoring and incident response, too. Logs forwarded to SIEMs, observability platforms, or similar tools allow organizations to:
- Detect behavioral anomalies, such as unusual access patterns or privilege escalations.
- Conduct forensic analysis in the event of a security incident.
- Maintain comprehensive records for compliance audits and root cause investigations.
Before implementing a CNAPP, this approach provides foundational visibility and analysis for Kubernetes environments. While a CNAPP consolidates and automates runtime security, compliance, and threat detection across the stack, external audit log management can serve as a stepping stone for teams building out their cloud-native security strategy incrementally.
Overall, combining tailored policies with strong external storage solutions helps Kubernetes audit logs become powerful tools for proactive monitoring, compliance, and post-incident analysis.
Scale Log Management with Intelligent Filtering
As Kubernetes clusters scale, the sheer volume of audit logs can overwhelm traditional storage and analysis methods, making it difficult for teams to continue extracting meaningful data. Effective log management at scale means intelligent filtering and context-aware tools prioritizing critical information. To manage scalability:
- Log Selectively: Use Kubernetes audit policies with omitStages and fine-tuned rules to log only what is essential for security and compliance.
- Establish Efficient Storage Backends: Route logs to lightweight, scalable storage systems optimized for cloud-native environments. Avoid over-reliance on legacy systems that may not scale effectively with Kubernetes workloads.
Next, add context to audit logs. While Kubernetes audit logs provide critical API-level activity records, they lack runtime and behavioral context.
- Correlate log events with runtime context (e.g., active processes, container configurations, or network traffic) to distinguish normal behavior from potential threats.
- Highlight logs related to high-value or high-risk assets so teams focus on the events that matter most.
- Recognize the dynamic cloud environment when using audit logs. Prioritize alerts and monitoring based on live changes in your cluster, avoiding unnecessary resource overhead.
By focusing on critical events, using external storage, integrating with incident response workflows, and scaling intelligently, teams can use Kubernetes audit logs as a force for securing dynamic cloud-native environments. These best practices offer a roadmap for balancing scalability, security, and operational efficiency in even the most complex clusters.
Runtime Security with Audit Logs
Kubernetes audit logs are a real-time source of activity data within the cluster, offering visibility into API-level actions as they happen. With auditing enabled, DevSecOps teams can monitor events like user or container access attempts, actions performed, and whether those actions succeeded or failed.
When properly configured and monitored, audit logs provide critical visibility into runtime security and compliance readiness. That enables security teams to:
- Demonstrate compliance with access management standards.
- Quickly identify and respond to runtime threats.
- Maintain a clear record of activity for forensic investigations.
While Kubernetes audit logs are not a comprehensive runtime monitoring solution, they form a vital component of runtime security workflows when combined with external analysis tools.
Detecting Runtime Threats with Kubernetes Audit Logging
Kubernetes audit logs capture a range of events that can signal potential runtime security threats. These include:
- Unauthorized Access Attempts:
Audit logs track access attempts to resources, as defined by the audit policy. Unauthorized attempts can trigger security alerts, notifying incident response teams of potential breaches. - Configuration Changes:
Changes to Kubernetes configurations, such as RoleBindings or resource quotas, can be logged to identify misconfigurations or unauthorized updates. This visibility helps teams roll back problematic changes, investigate suspicious activity, or ensure compliance. - Resource Manipulation:
Logs can be configured to flag containers or users exceeding assigned resources. Excessive usage — especially if it follows attack patterns like cryptojacking or denial-of-service attacks — can alert teams to malicious activity. - Privilege Escalation:
Attempts to gain unauthorized access to higher-level resources or escape container boundaries are logged when included in audit policies. This helps teams detect and interrupt privilege escalation attacks in progress or use the logs for post-incident forensic analysis. - Data Exposure Events:
Logs capturing access to sensitive data stores like etcd or attempts to exfiltrate data from containers can signal potential breaches. External monitoring solutions augment this detection, enabling real-time alerts and mitigation.
Improving Runtime Security with Audit Logs
Kubernetes audit logs offer valuable insight into runtime events but work best as part of a layered security strategy. Here’s how to enhance runtime security using audit logs:
- Pair Logs with Runtime Monitoring Tools: While audit logs track API-level events, runtime monitoring tools provide extra visibility into process-level and network activities, filling critical gaps.
- Use Automated Alerts: Forward audit logs to SIEMs or other tools that can analyze patterns and generate real-time alerts for high-severity events.
- Correlate Events Across Layers: Combine audit logs with runtime and network telemetry to build a comprehensive view of activity, helping identify and respond to complex attack patterns like lateral movement.
Upwind Secures Kubernetes
Attacks often begin with subtle actions that might be tagged as separate events in a Kubernetes audit log. With Upwind’s runtime security and Issue Stories, these events gain context as part of the full attack sequence, allowing for a clearer picture of how incidents unfold. With multi-cluster visibility, correlated events, and behavioral analysis, Kubernetes has never been more secure.
Want to see what Upwind adds for DevSecOps teams? Learn more about Upwind’s Kubernetes security and get advice on best practices with a demo.
Frequently Asked Questions
What’s the minimum audit log configuration for security compliance?
In most cases, organizations should retain audit logs for at least 90 days. However, some regulations may stipulate longer storage, as is often the case in sensitive and/or critical industries like healthcare and finance. Many organizations find that a minimum of one year satisfies most regulatory requirements.
How do you handle audit logs at scale?
Organizations need to utilize a centralized logging system with strong data storage capabilities, like a data lake, that can aggregate, store, and analyze large volumes of data to support compliance, threat detection, and forensic analysis. Centralized logging systems, effective storage, and optimized log volume are the first steps in scaling.
Complementary tools, like runtime-powered CNAPP such as Upwind, can add additional layers of context by detecting runtime anomalies.
How do you integrate audit logs with existing security tools?
Integrating Kubernetes audit logs with existing security tools bridges the gap between cluster-specific activity and broader security workflows. By centralizing, formatting, and correlating log data, organizations can unlock actionable insights, detect complex threats, and streamline compliance reporting. The first steps share much in common with the steps organizations must take in order to scale logs. Teams will need to:
- Centralize audit logs for accessibility, with a log management system or SIEM
- Format logs for ingestion, with normalized schema and structure for your tools
- Integrate with security tools for correlation, defining rules, correlating data across sources, and setting up pipelines
- Establish monitoring and alerts, to track security events
- Iterate and refine rules over time, with fine-tuning to ensure logs are able to surface true security events
What audit events should you monitor for security threats?
Focus on events that signal high-risk behaviors, anomalies, or potential misconfigurations that attackers often exploit. Here are the key categories of audit events to prioritize:
- Access Management Events: Track failed login attempts, unauthorized access to sensitive resources, and privilege escalation activities. These often signal credential misuse or the initial stages of an attack.
- Configuration Changes: Monitor updates to RBAC permissions, ConfigMaps, NetworkPolicies, and resource quotas to catch unauthorized or risky changes.
- Resource Anomalies: Identify unexpected resource usage, such as pods consuming excessive CPU or memory, which could indicate cryptojacking or denial-of-service attempts.
- Data Access Events: Focus on API calls to etcd, databases, or persistent volumes and detect unusual outbound data transfers that could signal exfiltration.
- Administrative Actions: Log system-level actions like changes to the kube-apiserver configuration, audit policy updates, or unexpected SSH access to nodes.
By prioritizing these audit events and integrating logs with analysis tools, teams can detect security threats early, respond effectively, and maintain compliance without being overwhelmed by noise.


