
We are excited to announce a powerful new functionality in the Upwind platform that enhances security and compliance by automatically visualizing sensitive data flow data in the Upwind Topology Map. This feature helps organizations quickly identify and mitigate risks by providing clear insights into how sensitive data moves across their cloud environment.
How Upwind Classifies Sensitive Data
Upwind tracks sensitive data on layers 3, 4 and 7, which correspond to key network functions: Layer 3 (Network) handles IP-based traffic routing, Layer 4 (Transport) manages data flow control between devices, and Layer 7 (Application) involves communication at the software level, such as API calls and web transactions. Sensitive data is classified either by organizations using a tagging system to indicate sensitive data assets, or by the Upwind sensor using pattern recognition to identify common sensitive data patterns such as credit card numbers, identification numbers, and more.
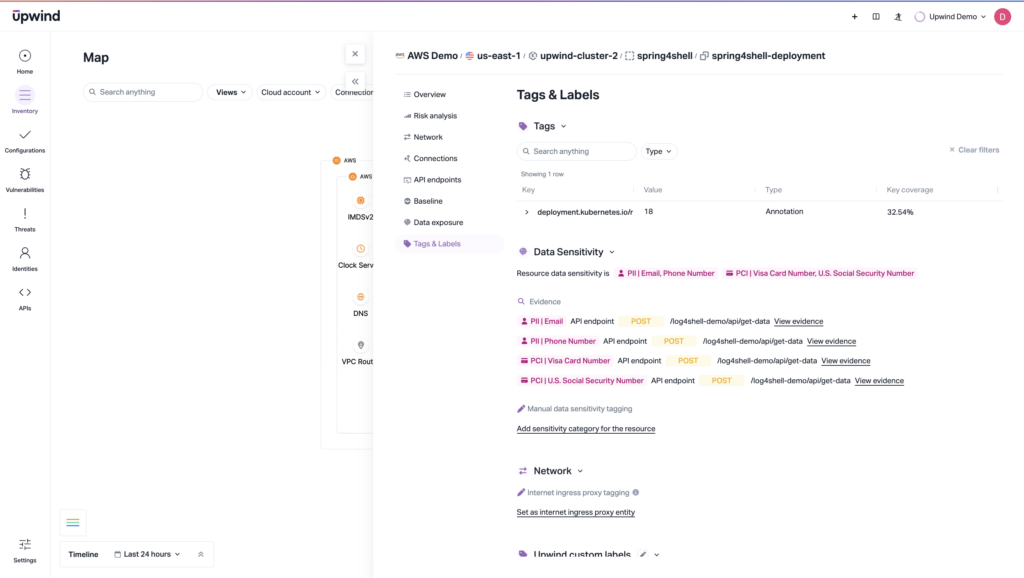
When sensitive data is detected, it is labeled with a sensitive data tag and classified by its type and category. Examples of sensitive data that Upwind identifies include:
- PHI data: patient information, medical records & insurance information
- PII data: SSNs, IDs and emails
- PCI data: credit cards and billing information
The sensitive data is then masked at the network and application levels, ensuring that sensitive data is never transmitted outside the customer’s environment while maintaining visibility for security monitoring.
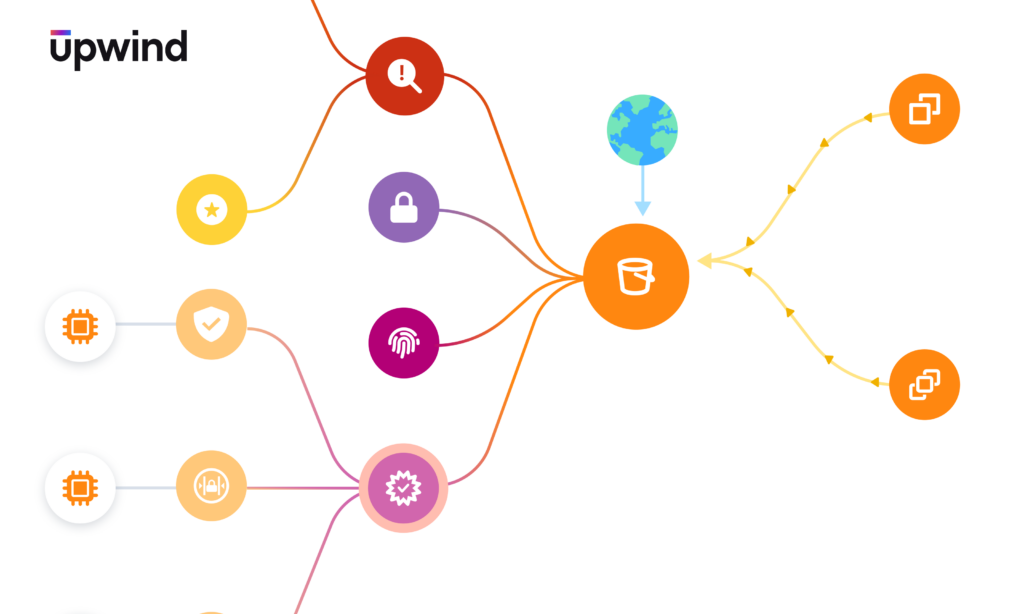
Viewing Sensitive Data Flows in the Upwind Topology Map
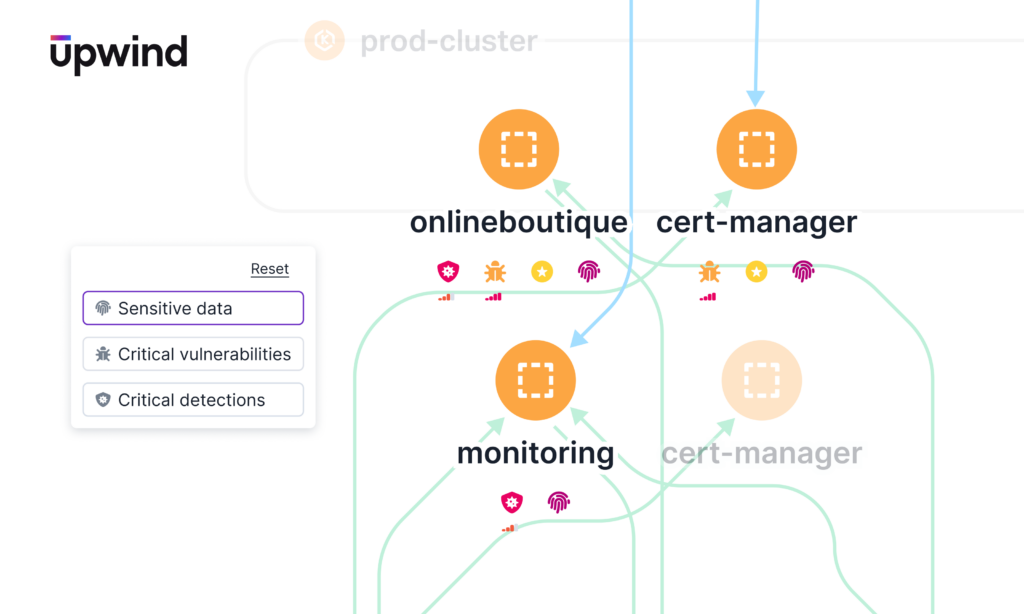
Upwind has always provided the ability to view which resources in your environment contain sensitive data. With this latest update, you can filter the map to show sensitive data, integrating data from layers 3, 4 and 7 to provide a comprehensive view of sensitive data flows.
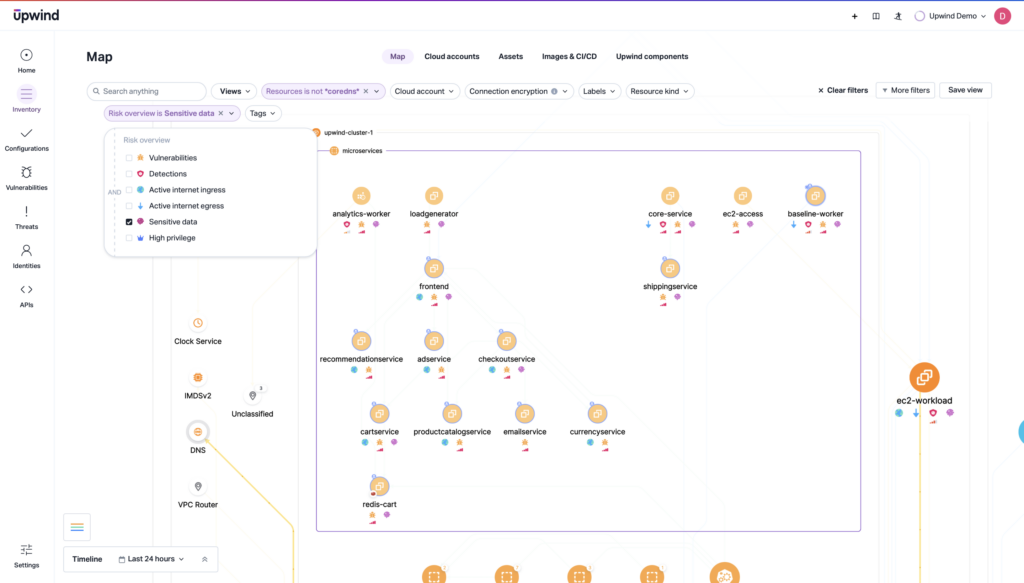
This ability to comprehensively view network topology with sensitive data along with API sensitive data flows makes it seamless to track your most sensitive assets, giving you:
- Increased visibility of sensitive data, including real-time data flows
- Proactive filtering to focus investigations on assets that contain sensitive data
- Proactive protection by monitoring for any changes in sensitive data flows and activities
Use this newest functionality to view, track and filter sensitive data flows on layers 3, 4 and 7 – helping to detect unauthorized access, prevent data leaks and mitigate compliance risks before they become critical threats. To get ahead of security risks and see Upwind’s real-time sensitive data tracking in action, schedule a demo today.